Representation
Most of what we know comes through some form of media, some form of secondhand representation. A great deal has been said on who and what gets represented in journalism, and how certain people and ideas are presented. Adding data does not change the basic nature of these issues, but data is a different kind of information that lends itself to different kinds of communication.
I tend to think of information as coming in two different flavors: examples and statistics. The story of someone looking for a job is an example, while the unemployment rate is a statistic. People also talk about anecdotes versus data, or case studies versus surveys, or narratives versus numbers, or maybe qualitative and quantitative. Not all of these pairs are talking about quite the same thing, but they all capture some kind of difference. I don’t think these modes of information are in opposition, or even that the boundary is really all that clear. (What would you call the ethnographies of a randomly sampled set of people?) But I do see two very general patterns in the way information can be collected.
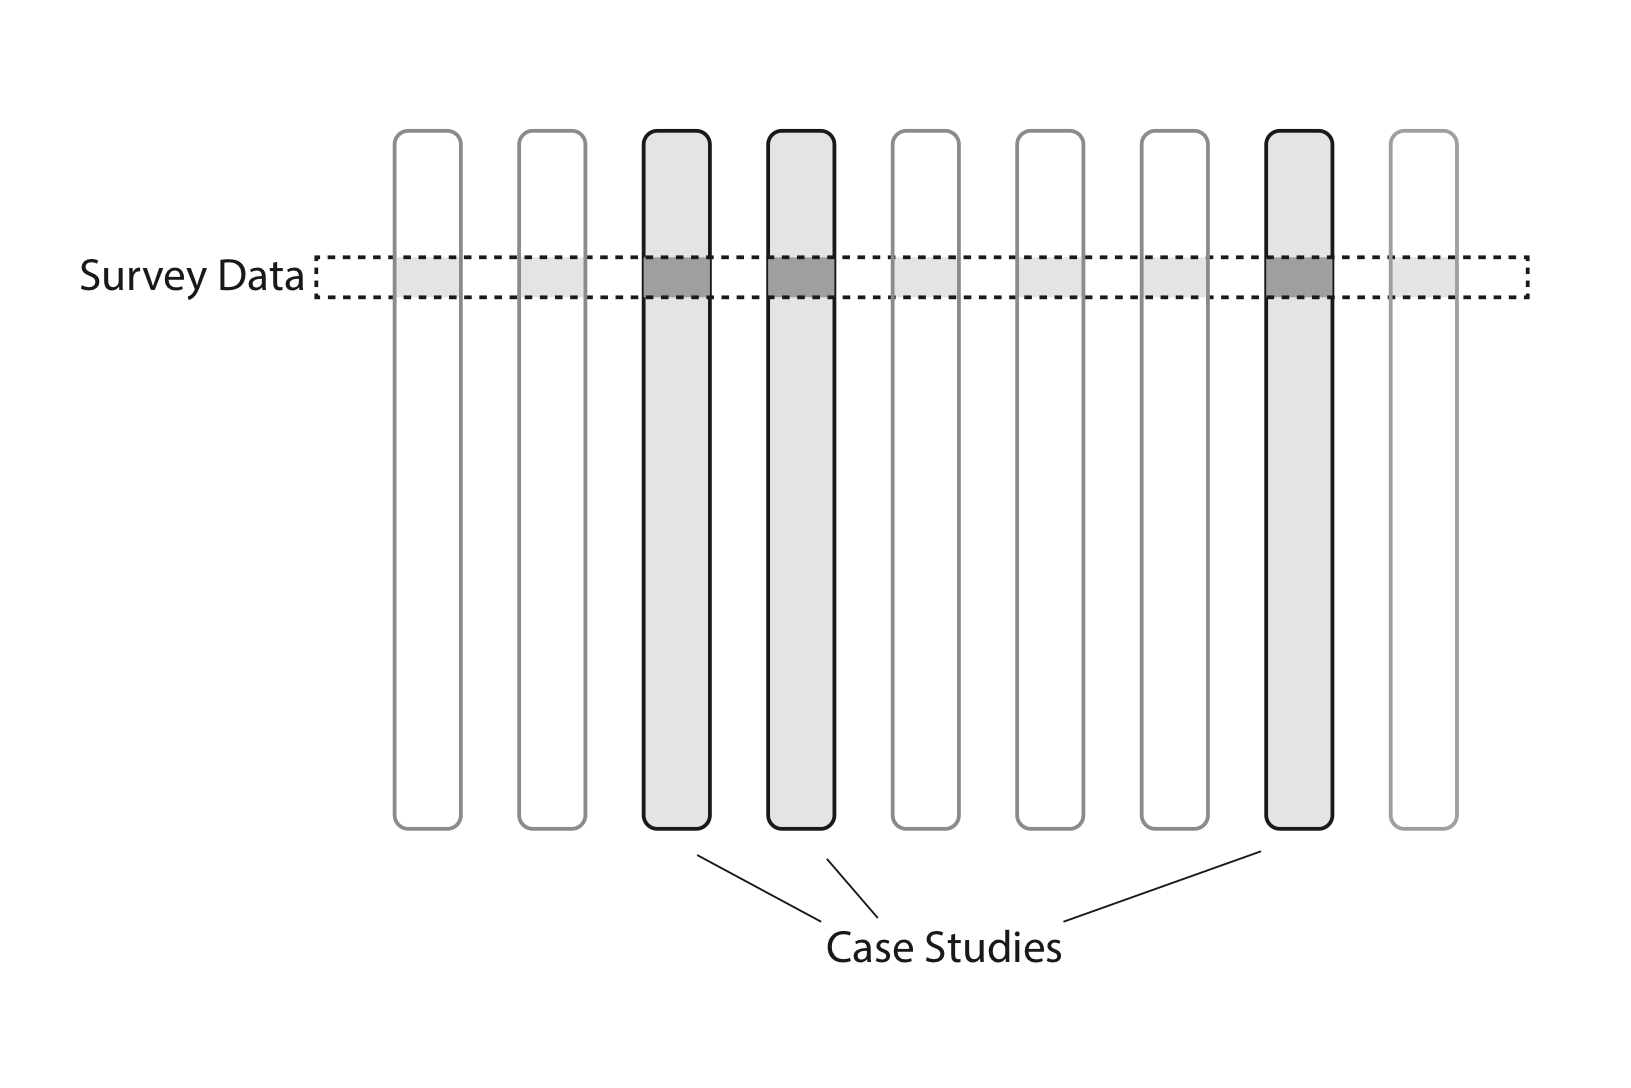
You can collect a small amount of specific information from many people and summarize it with statistics. Or you can collect rich, open-ended information from just a few people and present each as an in-depth example. In this sense statistics and examples are complementary forms, and both can be used to represent a broader group of people. That is, both can be used to infer information we did not collect—additional details about the lives of more people. All representation is generalization.
Consider unemployment again. A survey asks a few questions of many people, so that we can count how many people are unemployed. We can also find patterns of connection between employment status and location, education, age, and so on. To see these patterns truly, without bias, we must either count every single person or take a random sample. That is, a random sample is a representative sample. But we also need to understand the lives of individual people, or we cannot ever understand how these societal forces play out in practice. Maybe we know that people of a certain race have higher unemployment, but how does this actually happen? What goes on in such a person’s life when they are looking for a job? What did they hear in their last interview? The unemployment rate cannot answer these sorts of questions, but the stories of individual people can.
In the best case, a story combines numbers and narratives. The data represents many people in a narrow but meaningful way, while stories relate the deep experiences of only a few, and these different types of information together describe a unified reality. But this is only what’s on the page.