Counting Possible Worlds
You probably use words like “odds,” “chance,” “frequency,” and “probability” all the time to refer to uncertain events. But before we can go any further we need to get precise about what these words mean. You have to get the basics right or smart people in your audience will make fun of you, and besides you won’t be able to calculate anything correctly.
These simple ideas are no less profound for being old and really only emerged in the late 1600s.xiii Even if you’ve been through this before, perhaps I can offer a new perspective. Statistics counts possible worlds.
Probability is a way of reasoning about events that we can’t observe. Maybe we can’t see what’s happening because of practical problems: what’s the temperature at the center of the sun? But quite commonly, we will use probability to talk about potential worlds: what would happen if we choose this policy?xiv The central insight of probability is that in many of these situations you know more than nothing.
Perhaps you don’t don’t know what the next roll of the die will be, but you do know that all possibilities will occur in equal proportions. Or you might know that your friend usually orders a blueberry cheesecake at your weekly dinner date, and less commonly the lemon tart. You can use numbers to express these ideas. A probability of 0 means “impossible” while a probability of 1 means “certain,” and all probabilities have to add up 1.
Probabilities are like a percentage in that they are proportions, not counts, and when someone says “percentage chance” they usually mean probability times 100. But it’s often more intuitive to think about probabilities as frequencies, actual counts of different outcomes. Suppose that over the next five dinners with your friend you would expect her to order two blueberry cheesecakes and three lemon tarts. This hasn’t actually happened yet so we’re not counting actual deserts, but rather the deserts we expect; probability is a language for talking about our uncertainty.

The counts here are frequencies. Probabilities are just the ratio of one type of event to all events.
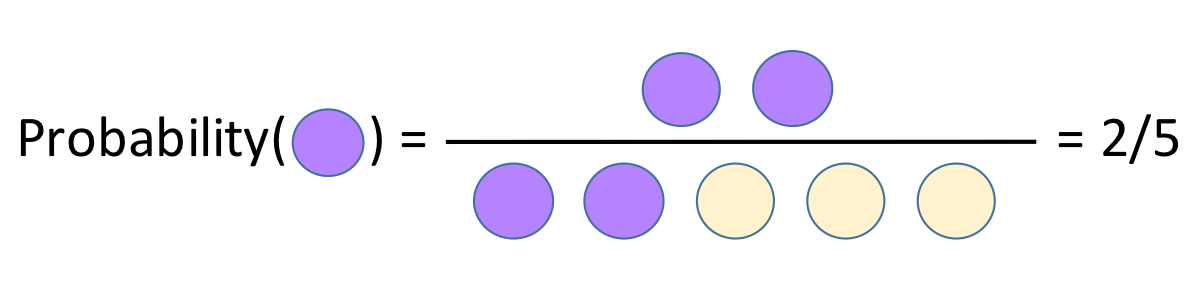
The probability that something happens is usually written p(something). In this case p(cake) = 0.4, but like a variable in an equation, you may or may not know the value of your p(something). It may stand in for a number that someone has previously measured or computed, or it may be what you’re trying to work out.
The odds are a slightly different way of talking about the same proportion.
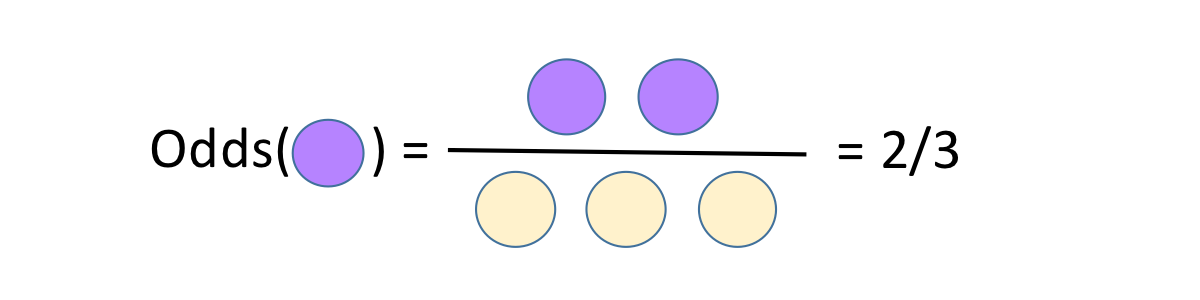
The odds are defined as the number of events we are counting divided by the number we are not counting. In gambling the odds are the number of times you win divided by the number of times you don’t. The odds of cake here are 2/3 or 0.66, but we usually report odds by giving the numerator and the denominator separately: the odds are 2 to 3. You can convert odds to probability by dividing the first number by the sum of the two: 2 to 3 odds is a probability of 2 / (2+3). Odds of 1 to 1 mean a probability of 1 / (1+1) = 1/2, or a 50/50 chance.
Although “odds” and “probability” are both numeric measurements of chance, they are different formulas and if you confuse them you will get the wrong answer. Don’t be that journalist. (You’re also welcome to correct people when they use the wrong words, but remember: pedants die alone.)
We can do some nifty things with simple probabilities. How many cakes do you expect your friend to order over the next 20 dinners? This is just p(cake) × 20 = 0.4 × 20 = 8. You can think of 0.4 as the average number of cakes she orders per dinner. Of course there is randomness here; she actually orders either zero or one cakes each time, and over the course of 20 dinners she might order 7 or 9 or 17 cakes, but 8 will be the most common number. (Because there are two possible desert choices, you get a binomial distribution just like the sampling distribution from the last chapter.)
Quite often we will need to count how frequently multiple events occur together. What is the probability that your friend orders cheesecake at the next two dinners? Let’s draw every possible combination of her first and second desert orders.
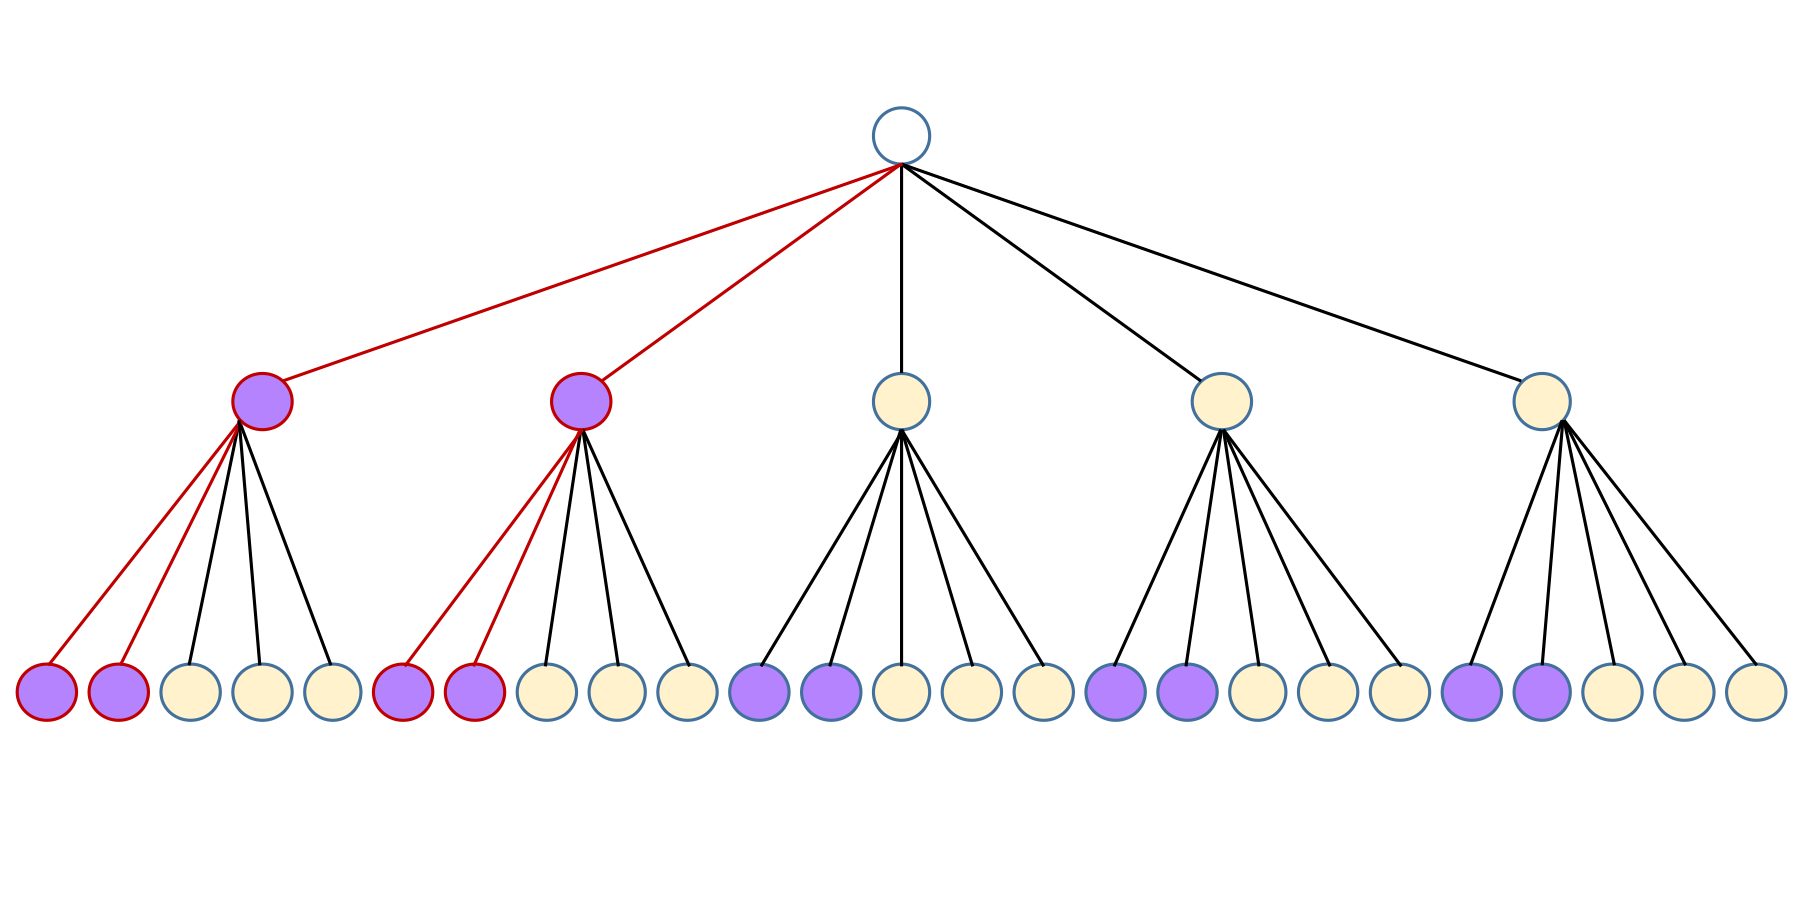
For her first dinner she orders cake 2 out of 5 times. After each of those, she orders cake again 2 out of 5 times. Hence there are 2 × 2 = 4 possible worlds where you get two cake orders in a row. Since there are 25 possibilities in total, the probability is 4/25 or 0.16.
Or, we could just multiply p(cake) × p(cake) = 0.4 × 0.4 = 0.16. The definition of probability divides out the total number of cases so that probabilities are always between 0 and 1, which lets us avoid the tedious bookkeeping of counting cases directly when all we want is the final proportion. Multiplication is how you work out the probability that event A and event B both happen when the events in question are independent, that is, one doesn’t affect the other. Whether or not this is true is a question your data cannot answer. A coin doesn’t care if it came up heads or tails last time, but maybe your friend will get tired of too many cakes in a row.
We can apply the multiplication rule to our assaults data. Suppose we can work out the probability that we’ll see a quarter with 80 or fewer assaults just by chance, even if the earlier closing time did nothing. Call this p(low). Then the probability that we’ll see two low quarters in a row is p(low) × p(low), the probability of seeing three low quarters in a row is p(low) × p(low) × p(low), and so on.
In practice you don’t work out probabilities by drawing trees, just as you don’t work out the margin of error by drawing pictures of samples. Still, I love thinking in terms of trees of possibilities because it makes plain what we are doing with probability arithmetic. Each branch is a possible course through history, and we are assigning probabilities by counting the branches of different types. All of statistics is based on the idea of counting possibilities.