Arguing From the Odds
We can use the logic of counting cases to work out the probability of an unlikely event happening by chance. In the winter of 1976 the United States embarked on a nationwide flu vaccination program, responding to fears of an H1N1 virus epidemic (a.k.a. swine flu). Millions of people lined up across the country to get vaccinated. But some of them got sick after, or even died. The New York Times wrote an editorial:
It is disconcerting that three elderly people in one clinic in Pittsburgh, all vaccinated within the same hour, should die within a few hours thereafter. This tragedy could occur by chance, but the fact remains that it is extremely improbable that such a group of deaths should take place in such a peculiar cluster by pure coincidence.26
But is it really “extremely improbable?” Nate Silver has estimated the odds:
Although this logic is superficially persuasive, it suffers from a common statistical fallacy. The fallacy is that, although the odds of three particular elderly people dying on the same particular day after having been vaccinated at the same particular clinic are surely fairly long, the odds that some group of three elderly people would die at some clinic on some day are much shorter. > > Assuming that about 40 percent of elderly Americans were vaccinated within the first 11 days of the program, then about 9 million people aged 65 and older would have received the vaccine in early October 1976. Assuming that there were 5,000 clinics nationwide, this would have been 164 vaccinations per clinic per day. A person aged 65 or older has about a 1-in-7,000 chance of dying on any particular day; > the odds of at least three such people dying on the same day from among a group of 164 patients are indeed very long, about 480,000 to one against. However, under our assumptions, there were 55,000 opportunities for this “extremely improbable” event to occur—5,000 clinics, multiplied by 11 days. The odds of this coincidence occurring somewhere in America, therefore, were much shorter—only about 8 to 1 against.27
This is a mouthful. It doesn’t help that Silver is switching between probabilities (“a 1-in-7000 chance”) and odds (“480,000 to one”). But it’s just a bunch of probability arithmetic. The only part that isn’t simple multiplication is “the odds of at least three such people dying.” In practice your calculator will have some command to solve these sorts of counting problems. The more fundamental insight is that you can multiply the probability of three people dying on the same day in the same city by the number of opportunities where it could happen to work out how often it should happen.
To be sure, this can only be a rough estimate; there is a big pile of assumptions here, such as the assumption that death rates don’t vary by place and time. But the point of this exercise is not to nail down the decimals. We’re asking whether or not we should believe that chance is a good explanation for seeing three post-vaccination deaths in one day, and we only need an order-of-magnitude estimate for that. Rough estimates can be incredibly useful for checking your story, and there’s a trove of practical lore devoted to them.28
The odds “8 to 1 against” is a probability of 1/9, or an 11 percent chance that we’d see three people from the same clinic die on the same day. Is this particularly long odds? This question is hard to answer on its own.
The less likely it is that something can occur by chance, the more likely it is that something other than chance is the right explanation. This sensible statement is no less profound when you think it through. This idea emerged in the 1600s when the first modern statisticians asked questions about games of chance. If you flip a coin 10 times and get 10 heads, does that mean the coin is rigged or are you just lucky? The less likely it is to get 10 heads in a row from a fair coin, the more likely the coin is a fake. This principle remains fundamental to the disentangling of cause and chance.
Coins and cards are inherently mathematical. Random deaths are a sort of lottery, where you can multiply together the probabilities of the parts. It can be a little harder to see how to calculate the probabilities in more complex cases. The key is to find some way of quantifying the randomness in the problem. One of the earliest and most famous examples of accounting for chance in a sophisticated way concerns a fake signature, millions of dollars, and a vicious feud of the American aristocracy.
In 1865, Sylvia Ann Howland of Massachusetts died and left behind a 2,025,000-dollar estate—that would be about 50 million dollars today. But the will was disputed, there was a lawsuit, and the plaintiff argued that the signature was traced from another document. To support this argument, the mathematician Benjamin Peirce was hired to prove that the original signature could not match the disputed signature so closely purely by chance. The signatures looked like this:
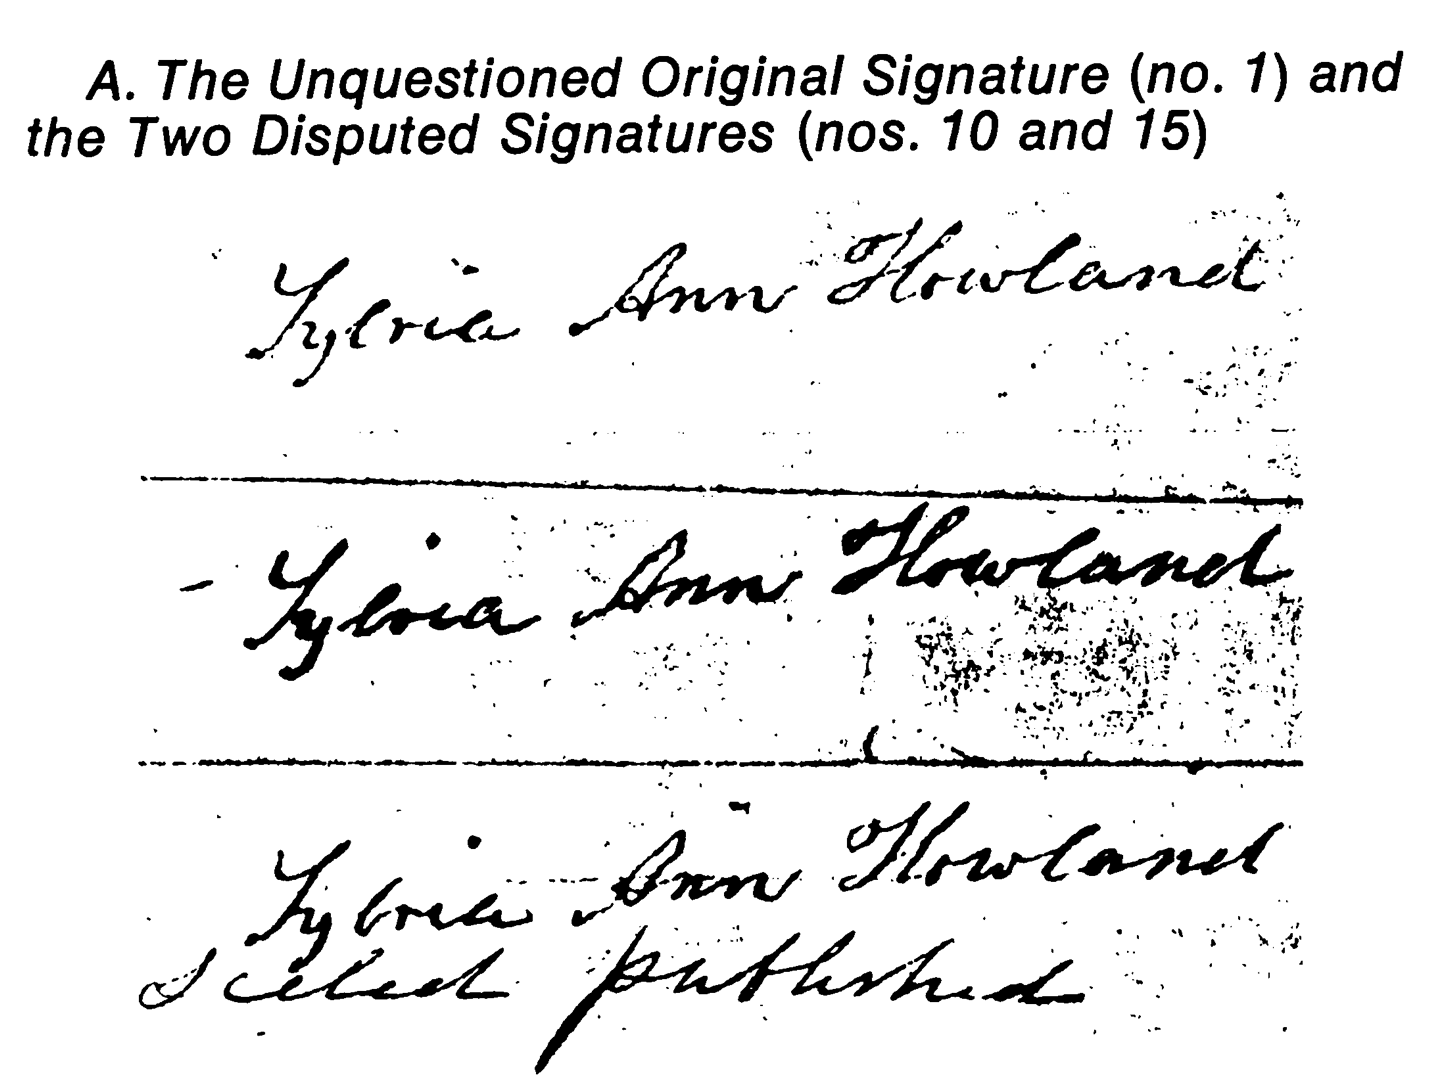
A known genuine and two possibly forged signatures in the Howland will case. From Meier and Zabell, 1980.29
To work out the probability of these two signatures matching by chance, Peirce first worked out how often a single stroke would match between two authentic signatures. He collected 42 signatures from other documents, all of them thought to be genuine. Then he instructed his son, Charles Sanders Peirce, to superimpose each of the 861 possible pairs of these 42 signatures and count how many of the 30 downward-moving strokes aligned in position and length. Charles found that the same stroke in two different signatures matched only one-fifth of the time. This is the key step of quantifying random variation, which Peirce did by counting the coincidences between signatures produced in the wild.
But every stroke of every letter matched exactly between the original and disputed signatures. The elder Peirce wanted to show just how unlikely it was that this could happen by chance, so he assumed that every stroke was made independently which allowed him to use the multiplication rule for probabilities. Since there are 30 strokes in the signature and a 1/5 chance of any single stroke matching, he argued that the positions of the strokes of two genuine signatures should match by chance only once in 5 × 5 × 5 × 5 × 5 × 5 × 5 × 5 × 5 × 5 × 5 × 5 × 5 × 5 × 5 × 5 × 5 × 5 × 5 × 5 × 5 × 5 × 5 × 5 × 5 × 5 × 5 × 5 × 5 × 5 times, that is, once in 530. This is a fantastically small number, a 0.0000000000000000001 percent chance of a random match. According to this calculation, if you signed your name like Mrs. Howland and did it a billion times you would never see the same signature twice; one in a billion would be a much healthier 0.0000001 percent chance. A modern analysis which does not assume independence of each stroke gives a probability several orders of magnitude more likely, but still extraordinarily unlikely.xv
It seemed much more likely that the signature was forged by Hetty Robinson, Sylvia Ann Howland’s niece who was contesting the will. Robinson had access to the original documents and stood to gain millions of dollars by tracing Mrs. Howland’s signature on an extra page spelling out favorable revisions.
I admit I’m disappointed that the case was ultimately decided on other grounds, rendering this analytical gem legally irrelevant. But the event was a milestone in the practical use of statistics. Statistics was mostly applied to physics and gambling at that time, never anything as qualitative as a signature. The trick here was to find a useful way of quantifying the variations from case to case. Charles Sanders Peirce went on to become one of the most famous nineteenth-century scientists and philosophers, contributing to the invention of the randomized controlled experiment and the philosophical approach known as pragmatism.30
The probability that you would see data like yours purely by chance is known as the p-value in statistics, and there is a popular theory of statistical testing based on it. First, you need to choose a test that defines whether some data is “like yours.” Peirce said a pair of signatures is “like” the two signatures on the will if all 30 strokes match. Then imagine producing endless random data, like scribbling out countless signature, or monkeys banging on typewriters. Peirce couldn’t get the deceased Howland to write out new pairs of signatures, so he compared all combinations of all existing known genuine signatures. The p-value counts how often this random data passes the test of looking like your data—the data you suspect is not random.
There’s a convention of saying that your data is statistically significant if p < 0.05, that is, if there is a 5 percent probability (or less) that you’d see data like yours purely by chance. Scientists have used this 5 percent chance of seeing your data randomly as the minimum reasonable threshold to argue that a particular coincidence is unlikely to be luck, but they much prefer a 1 percent or 0.1 percent threshold for the stronger argument it makes.31 But be warned: No mathematical procedure can turn uncertainty into truth! We can only find different ways of talking about the strength of the evidence. The right threshold to declare something “significant” depends on how you feel about the relative risks of false negatives and false positives for your particular case, but the 5 percent false positive threshold is a standard definition that helps people communicate the results of their analyses.
Let’s use this p < 0.05 standard to help us evaluate whether the 1976 flu vaccine was dangerous. By this convention, an 11 percent chance of seeing three people randomly die on the same day is evidence against a problem with the vaccine; you could say the occurrence of these deaths is not statistically significant. That is, because there is a greater than 5 percent chance that we’d see data like ours (three people dying) even if the vaccine is fine, it’s not a good bet to assume that these deaths were caused by a toxic vaccine. But this does not mean there is an 11 percent chance that the vaccine is safe. We haven’t yet said anything at all about the vaccine; so far we’ve only talked about the odds of natural death.
Really the question we need to ask is comparative: Is it more likely that the vaccine is harmful, or that the three deaths were just a fluke? And how much more likely? Is there greater or less than an 11 percent chance the vaccine is toxic and no one noticed during earlier testing? In the case of the Howland will, we found miniscule odds that two signatures could end up identical by accident. But what are the odds that Mrs. Howland’s niece forged the will? A more complete theory of statistics tests multiple alternatives.