Did the Policy Work?
In 2008 the Australian city of New South Wales had had enough of drunken assaults. The courts imposed an earlier closing time on bars in the central business district: No alcohol after 3 a.m. Now, 18 months later, you have been asked to write a story about whether or not this policy change worked. Here’s the data:

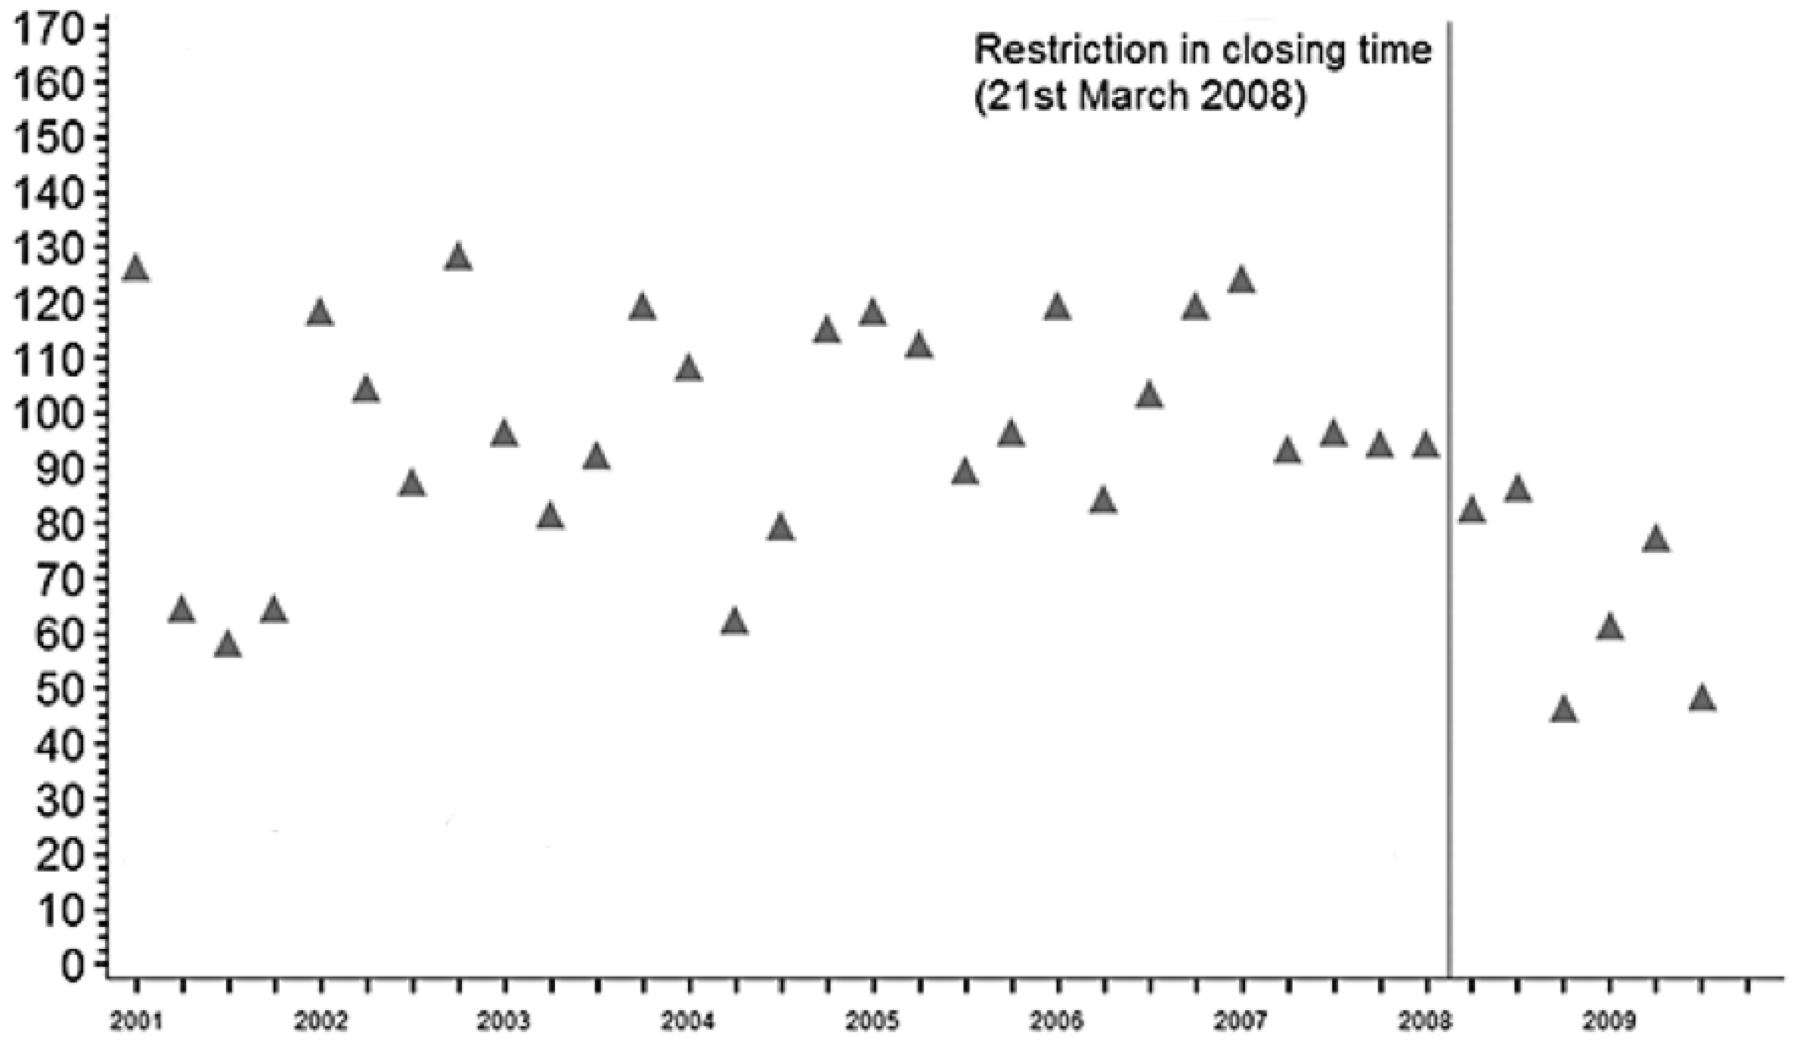
Number of nighttime assaults recorded by police in each quarter in the central business district (CBD) of New South Wales, where closing time was restricted to 3 a.m. Adapted from Kypri, Jones, McElduff and Barker, 2010.24
Our very first questions have to be about the source of the data, the quantification process. Who recorded this and how? Of course the police knew that there was a new closing time being tested—did this influence them to count differently? Even a true reduction in assaults doesn’t necessarily mean this is a good policy. Maybe there was another way to reduce violence without cutting the evening short, or maybe there was a way to reduce violence much more.
The first step in data analysis is seeing the frame: the assumptions about how the data was collected and what it means.
But let’s assume all of those questions have been asked, and we’re down to the question of whether the policy caused a drop in assaults. In principle, there is a correct answer. Out there, in the world, the earlier closing time had some effect on the number of nighttime assaults, something between “nothing at all” to perhaps “reduced by half.” Our task is to estimate this effect quantitatively as precisely as possible (and no more precisely than that).
This data is about as clear as you’re ever likely to see outside of a textbook. We have about seven years of quarterly data for the number of nighttime assaults in the central district before the new closing time went into effect, and 18 months of data after. After the policy change the average number of incidents is a lot lower, a drop from something like 100-ish per quarter to 60-ish per quarter.
So the policy seems to have worked. But let’s spell out the logic of what we’re saying here. If you can’t express the core of your analysis in plain, non-technical language, you probably don’t understand what you’re doing. Our argument is:
The range of the number of incidents decreased in early 2008.
The earlier closing time went into effect around the same time.
Therefore, the earlier closing time caused the number of incidents to decrease.
Are we right? There’s no necessary reason that the drop in assaults was caused by the earlier closing time. The evidence we have is circumstantial, and any other story we could make up to explain the data might turn out to be true. That’s the core message of this chapter, and the key skill in being right: Consider other explanations.
There are common alternative explanations that are always worth considering.
First, chance. Sheer luck could be fooling us. The actual number of assaults per quarter is shaped by circumstantial factors that we can’t hope to know. Who can say why someone threw a punch, or didn’t? And we have only six data points from after the new policy went into effect—could we just be seeing a lucky roll of the die?
Second, correlation. The decrease could be related to the earlier closing time without being caused by it. Perhaps the police stepped up patrols to enforce the new law, and it’s this increased presence that is reducing crime, not the new closing time itself.
Third, everything else. The change could be caused by something that has never occurred to us. Maybe there was a change in some other sort of policy that has a large effect on nightlife. Maybe crime was falling all over the country at the same time.
We’ll tackle these one at a time. To get there, we need to tour through some of the most fundamental and profound ideas of statistical analysis.